Warp Chart
Charts people can click into
Bars, lines, pies and big numbers from one Eloquent query, grouped in the database. Click a month to see its customers and then the orders, put last year and budget lines beside it, and link charts to each other.
Single Project $69 · Unlimited Projects $149
1.0.1 passed all 42 setups · Nov 20, 2026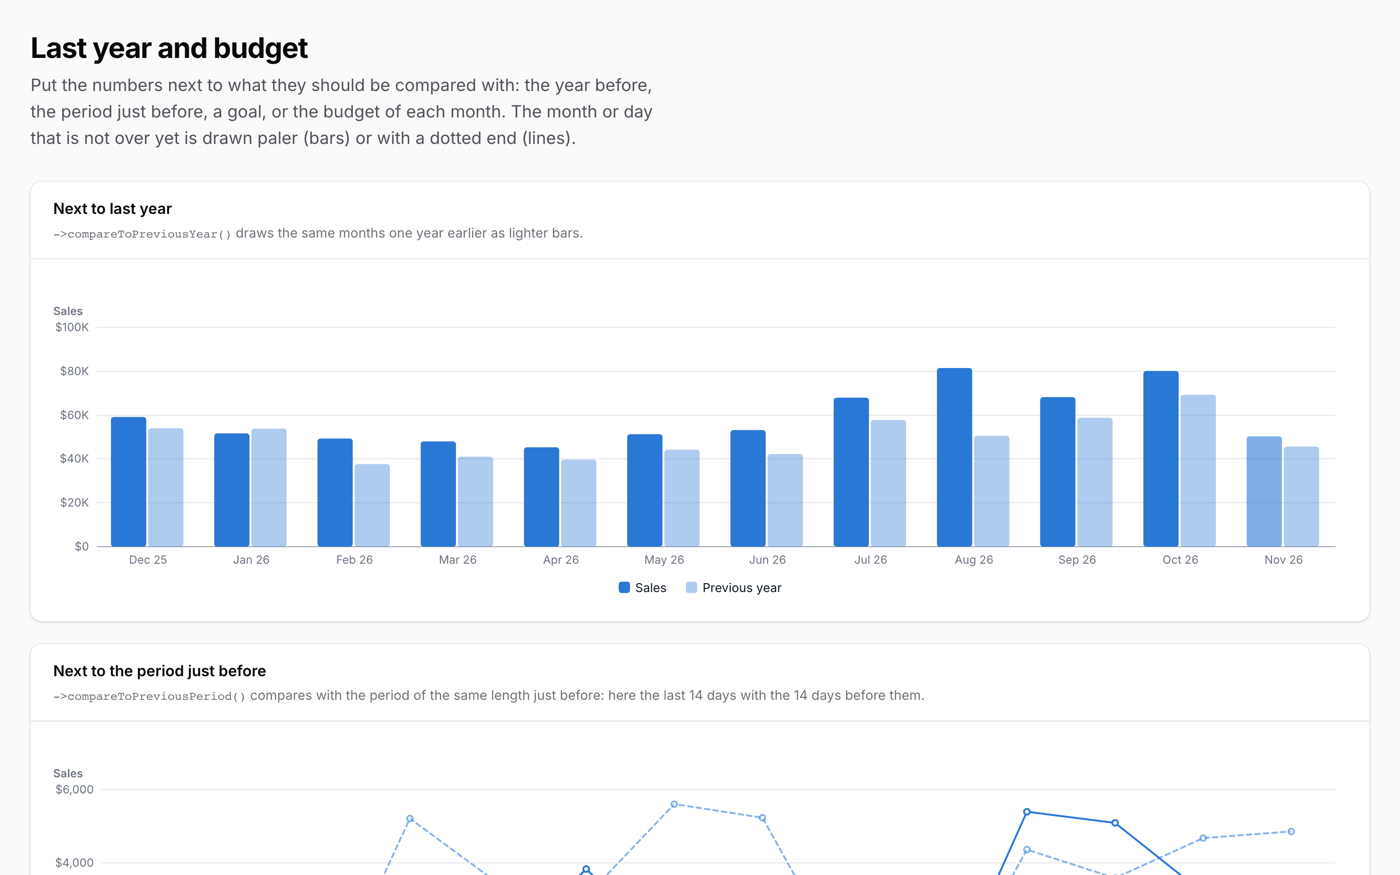
Watch it work
Short clips recorded in the live demo. Each one links to the page it was recorded on, so you can try it yourself.
Click a bar to see what is behind it
Click a month, then a customer, then a category, down to a list of the orders with links. Every click is one more level, and a button takes you back up.
Try it in the demo →Four charts that answer each other
Click "Paper" in the donut and the other charts show Paper only. Add a region: each choice becomes a badge, and each badge can be removed.
Try it in the demo →A chart that follows the form as you type
WarpChart reads the form with $get and redraws on every keystroke: the margin of each quote line and a goal line, live, with no request.
Try it in the demo →Last year and the budget beside every bar
Last year sits next to each bar, and every month has a budget mark that turns green when it is reached. One line of PHP each.
Try it in the demo →Actual against target, per rep
Each rep gets a bar with their own target line, or a meter, green once the target is reached. Click a rep to list their orders.
Try it in the demo →Choose a period by dragging
Drag across the small chart under the big one. The big chart zooms, and the donut and the totals beside it follow the same weeks.
Try it in the demo →Where the leads end up
One line draws the flow from source to stage to won or lost. Point at a band for the count, and click it to list exactly those leads.
Try it in the demo →What sales are made of, and when it is busy
Tiles of the whole that you can click into, down to the orders, and a heat map of weekday by hour. Both come from one Eloquent query.
Try it in the demo →In your code
// Anywhere a schema goes: forms, pages, widgets, modals
WarpChart::make('sales')
    ->bar()
    ->query(Order::class)
    ->perMonth('ordered_at')
    ->sum('total', 'Sales')
    ->drillDown('customer', 'category')
->compareToPreviousYear(),Install
After buying, you get an email address and a license key for the private Composer repository. The full steps are in the docs.
composer config repositories.qalainau composer https://qalainau.privato.pub/composer
composer config --auth http-basic.qalainau.privato.pub "your-email" "your-license-key"
composer require qalainau/filament-warp-chartQuestions about Warp Chart
- No questions yet. Ask the first one.
More plugins
Filament + AI coding tips, by email
How to fit Warp plugins into your own app and pair them with Claude Code or Cursor: prompts that work, mistakes AI makes, real examples. Once or twice a month. Unsubscribe anytime.
Thanks! You're on the list.